
Top 10 Facebook metrics you should track | Facebook metrics list

facebook insights
facebook metrics 2021
facebook metrics list to track
facebook advertising metrics and benchmarks
facebook engagement metrics
website types and purposes
facebook kpis
facebook internal metrics
Facebook has now cemented itself as crucial to every business marketing needs. What we have as a result is a lot of business owners trying to understand the already complex internal workings of the Facebook paid advertising platform. Business owners and agencies alike dig hard to establish what the Facebook advertising metrics and benchmarks are for their respective industries. While Facebook page insights does provide some information on KPI’s what it doesn’t tell you is which Facebook KPI’s are the real deal.
We thought we shed a little light on the matter and help you discern the vanity metrics from the real stuff.
1. Post Impressions
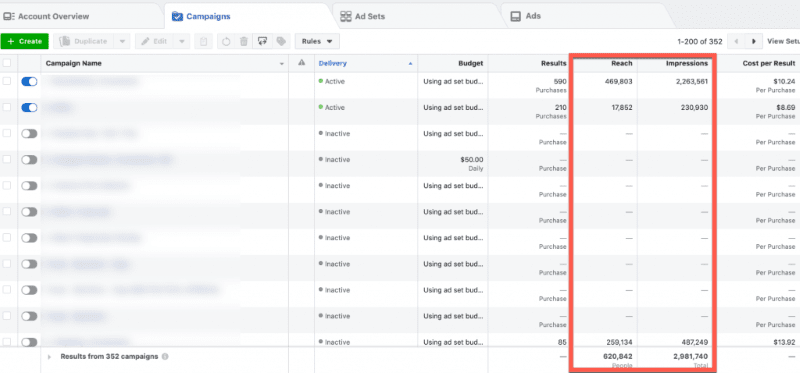
where to find post impressions
If you want to keep tabs on how many times your published content has been seen, the impressions metric is the one to follow.
Facebook defines impressions as: “a common metric used by the online marketing industry, and represents the number of times your ads/posts were on screen.”
What is interesting about impressions is that a high engagement rate on a Facebook post will increase its quality score. It makes sense right, if people are happy to engage with what you are sharing, then Facebook will be happy to show it more. In the case of paid advertising, this allows you to pay less per click, due to a higher quality score on your ad. ultimately allowing your budget to reach more Facebook users.
You can find this metric in Facebook Insights by following these steps:
- Go to your Facebook business page
- Spot the “Page Insights” button from your “Manage page” sidebar
- Access the “Posts” button located on the left sidebar of the screen
- Go to “Reach: Organic/Paid” and switch to “Impressions: Organic/Paid”
Facebook impressions are split into two main categories:
- Organic – the Facebook metric that shows how many times your posts have been displayed in people’s News Feed for free.
- Paid – the Facebook metric that counts the number of times people bumped into your content on their pages if you paid for its display.
How can you make the best out of your impressions?
Always compare them to the previous post via A/B tracking. This is why you have to keep track of them for a longer period, like a month or a quarter.
2. Engagement rate

Calculating Facebook engagement rate
Facebook engagement rate represents the average number of people who interacted with your post in some way or another: liked, shared, clicked, or commented on it. To us, the share, click, and comment categories of this metric are the of the most important Facebook metrics as it has the highest correlation with conversions.
Here is how to calculate the engagement rate: traditionally engagement rate was calculated as total engagement / total followers x 100. However, as we will explain later due to Facebook’s almost nill organic reach you should only ever calculate it on paid posts which would be total reach/post engagements.
There is also Video engagement which we’ve decided to group under one section. It’s similar to post engagement, the video engagement metric is specific to the Facebook videos you post. For videos, engagements are broken down into reactions, shares and comments.
Why you should track Facebook video engagement: The specific reactions tell you what your viewers are feeling when watching your videos and if they match your expectations.
Engagement Rate Ranking
Similar to quality ranking, engagement rate ranking is an ad relevance metric that can help you determine how effective your ads are at engaging your audience. It is a ranking of your ad’s expected engagement rate, including all clicks, likes, comments, and shares that are compared to ads competing for the same audience. The possible engagement rate rankings are Above Average, Average, Below Average (Bottom 35% of ads), Below Average (Bottom 20% of ads), and Below Average (Bottom 10% of ads).
Post Shares
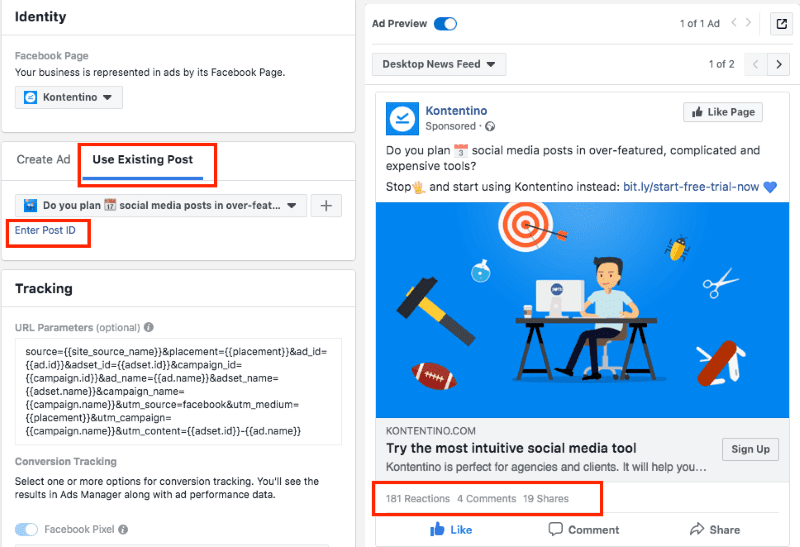
where to find post shares on facebook
Posts, including ads, can be shared by users to their timelines, to their friends’ timelines, in groups, and on their business pages. Someone has to be particularly engaged with a post to want to share it on their page or a friend’s page. It has to be something that they relate to enough to want to share with others, which is a significant difference from the more self-contained engagements like comments and likes that may not necessarily be seen by their friends’ list.
Page Likes
As you can probably guess, this metric is all about the number of likes your Facebook Page receives that can be attributed to your ads. No matter which engagement objective is used, it’s a good idea to always monitor how your ads influence your page likes. It must be said that page and post likes show of all the key metrics the lowest actual correlation with conversations this is why likes are often referred to as a vanity metric.
Likes used to be important in that people who would like your page would see posts organically so pages raced to get a ton of likes, however, this hurts facebooks bottom line, so they incrementally decreased organic reach to what is now less than 1%.
That’s right of the people the like your page less than 1% will see anything you posted. It’s a nice way for Facebook to tell you, you have to pay to play.
How do you increase your Facebook engagement rate?
- Produce relevant quality content. It goes without saying if your Facebook post is shown to somebody who is very interested in what you do, then they will engage with it. It’s all about quality over quantity.
- Encouraging conversations, ask for opinions. Lack of interaction in the comment section of a Facebook post is simply throwing away leads. You miss opportunities for your business or brand to further interact with clients learning about them, or strengthen your brand image with them.
- Re-post your top posts – When you re-post a piece of content, it can generate as much reach and engagement as the original post, sometimes even more.
Tailor your posts to suit your audience and build an audience that are your ideal clients.
3. Post Reach
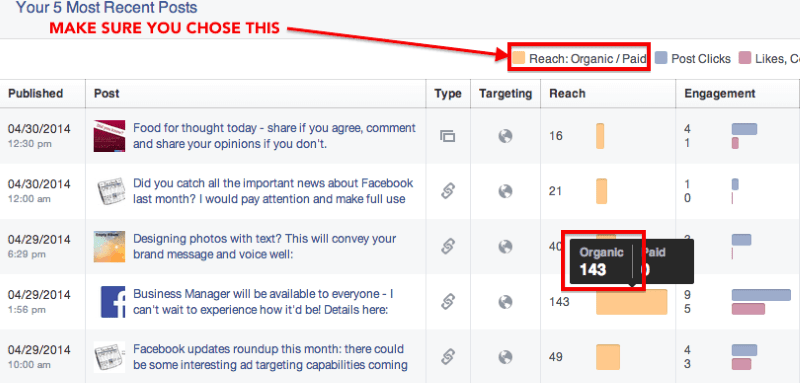
Where to find post reach on Facebook
Reach made our list as one of the important Facebook metric indicators as reach shows you the number of people who saw your post; this only counts when an ad or post reaches a unique person. Reach will always be smaller than the number of impressions as an impression shows all the views, including multiple views from the same person.
Organic Reach only tells how many people from your contacts have seen your post, while Total Reach shows all the people who saw your posts including people not in your fan list who saw the post via a paid ad.
How to increase Facebook post reach?
You can broaden your targeting on your post vis facebooks ads targeting.
Again you should create quality content that has a high engagement rate, the more people engage with your post, the more Facebook will show it around.
Encourage sharing, sharing is a great way to max out your post reach.
4. Conversions Rate ( Facebook )

Conversions Rate ( Facebook ) averages across industries
Cost Per conversion shows you how much you are paying for a lead or sale and Conversion Rate shows the percentage of people who not only clicked your ad but also made the purchase.
If a lot of people are clicking your ad at a low cost but not converting, then it means the ad is doing its job to make people click. However, people are not interested in what the link has to offer. It is not convincing people to convert. You would want to see a higher conversion rate for the percentage of the page clicked depending on your specific need.
5. Conversion Tracking with Google analytics.
If your post is redirecting to a website you can also set up a conversion on Google analytics. This can be an action such as a page view or form completion.
In your analytics dashboard, you can separate traffic and see all the traffic under the Social channel, this will be traffic that has come to your website being referred from a Social media page.
On this channel, you can view the conversions, based on what you have set on analytics and directly attribute those conversions to your Facebook marketing efforts.
6. Facebook Page Likes & followers
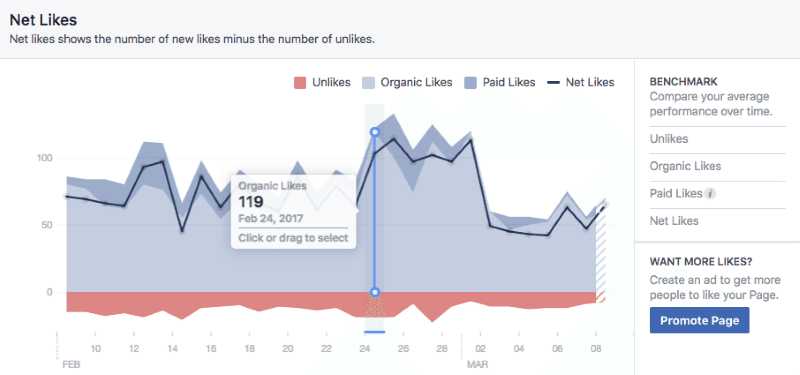
Facebook Like and followers graphs
As one of the very first metrics for Facebook Pages, Likes and follower numbers indicate how willing someone is to stay in touch with your brand. They might like a post or two but if they hit the Like or Follow button? They want to know what you’re up to.
Why you should track Page likes and followers: This metric tells you how interested someone is in your company. Likes and followers should not be standalone metrics, though. If you compare your impressions metric with the Likes metric, you’ll understand how far your posts are going.
Where to find it
You can find these metrics in the Pages tab of the Facebook Pages Report.
In Facebook Insights, likes are in the overview tab and audience section. And in Creator Studio, follower details are in the Insights tab and Audience section.
7. CPC ( Cost per Click )
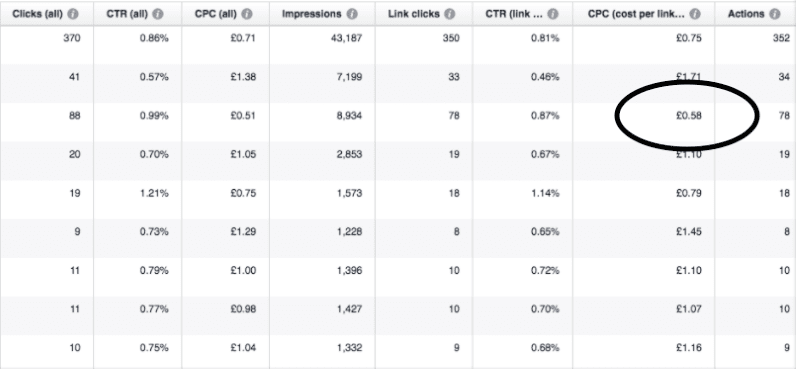
CPC ( Cost per Click )
Cost per click (CPC) is a paid advertising term where an advertiser pays a cost to a publisher for every click on an ad. If your campaign is set to charge for clicks (users have to click on an ad), then the CPC will be your metric.
If people are not clicking and your cost per click is high, then you need to make your ad more aggressive and attract more people to your link.
At the same time, if people are clicking on your ad but are not converting, then you need to make a strategy to attract high-quality leads that turn into customers.
8. Followers demographics
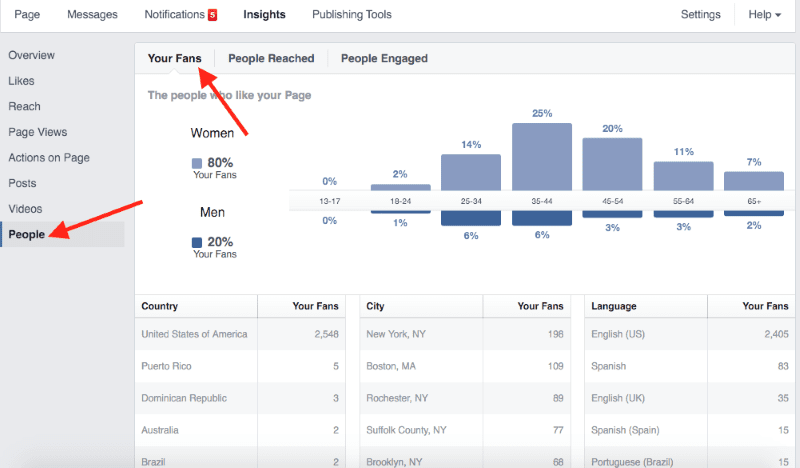
analysing follower demographics
Understanding where your audience comes from allows you to shape your tone of voice, message, and customize the content to your followers’ specific requirements.
You can do this by looking at the follower demographics such as gender, location (country or even city), and education.
Worldwide, 9.4% of the total active Facebook users are young women between 18 and 24 years old, and 13.8% of them are male users from the same age category, according to Statista.
9. CPA (Cost per Action)
Cost per action is also called cost per conversion, it is the cost paid after the action is taken by the audience instead of an impression.
10. Click-through rate (CTR)

facebook-benchmarks-average-click-through-rate
Click-through rate (CTR) measures the percentage of users who, after seeing your ad, clicked through to the landing page.
Click-through rate is an essential metric for measuring the performance of campaigns driving clicks to a website.
Clicks are one way of measuring this. But they don’t tell you if the audience you’re targeting is interacting with your ads.
A high CTR means the people seeing your ad are choosing to take the desired action (click through to the site). That means you’ve done a good job selecting your target audience and serving ads they are interested in.
A low CTR means either your targeting or ad creative (or possibly both) are off.
Facebook Metrics are unique to the organizations and campaigns they are measuring.
So while this list is designed to give you a start on the metrics that will be useful for tracking Facebook success, it will also need to be customized for your organization.
So to summarize the Top 10 Facebook metrics you should track are:
- Post Impressions
- Engagement rate
- Post Reach
- Conversions Rate ( Facebook )
- Conversion Tracking with Google analytics.
- Facebook Page Likes & followers
- CPC ( Cost per Click )
- Followers demographics
- CPA (Cost per Action)
- Click-through rate (CTR)
Social media marketing and management is playing a larger role in online marketing strategies than ever before. New Perspective Design spans all of the major social networks. Social media has become a crucial part of any effective marketing strategy for online business. However, posting daily and coming up with new engaging content can be time-consuming and difficult. Let us give you a hand.


0 Comments